Your quarterly readout is your best chance to show your CMO what customer proof does for revenue, and with Peerbound Measure, you finally have the data to show it. Here are the numbers to put in the deck and how to present each one.
A strong readout usually covers these, in roughly this order.
Win rate with and without customer proof
Revenue influenced by customer proof
The customers whose proof touches the most revenue
Your largest wins and the case study each referenced
Rep champions
Content gaps
Your next 3-6 priorities
This guide is one way to build the presentation; however, every CMO and every dataset is different, so treat it as a menu and pick what fits your story.
Note: The examples below use Peerbound demo data from Peerbound Measure.
How should you think strategically about your Measure data?
A strong readout answers three questions for your CMO: What impact is customer proof having on revenue? Where is that impact strongest? What will marketing do next? These three habits help get you there.
1. Start with what your CMO cares about most. Name the priorities on your CMO's radar this quarter, then lead with the data that shows your work's impact on them.
2. Find what's working and scale it. Look for the segment, deal stage, use case, customer, or rep where customer proof performs best. Watch for the customers whose proof shows up again and again in your largest wins. Showing where your work lands best tells your CMO what's driving results and where the program is headed.
3. Give every number a "so what" and a "now what." Each metric in the deck should carry an implication, a next step, and the business metric that step should move.
What customer proof data should you include in a CMO presentation?
1. Win rate with and without customer proof
Start with the comparison, since your CMO and CEO will care more about this lift than the revenue total. In the example data, deals with customer proof won 35% of the time versus 24% without it, about 1.5x as often. Plot both rates by month on a line chart labeled with the sample size and date range.
Measure's win rate view lets you set the starting stage, such as Discovery or Demo. Run the comparison from a few stages to see where customer proof moves win rate most, then coach reps to use it at that stage.

2. Revenue influenced by customer proof
Next, show closed-won revenue from deals where customer proof appeared and its share of total revenue. In the demo data, that's $12.9M, or 20% of $64.1M. Describe it as "influenced" revenue, meaning customer proof appeared in the deal before it closed.
Use the share to show the opportunity. The other 80% of revenue came from deals without customer proof, and getting proof into more deals like those could raise their win rate. Put both figures on one stat card next to last quarter or a baseline.

3. The customers whose proof touches the most revenue
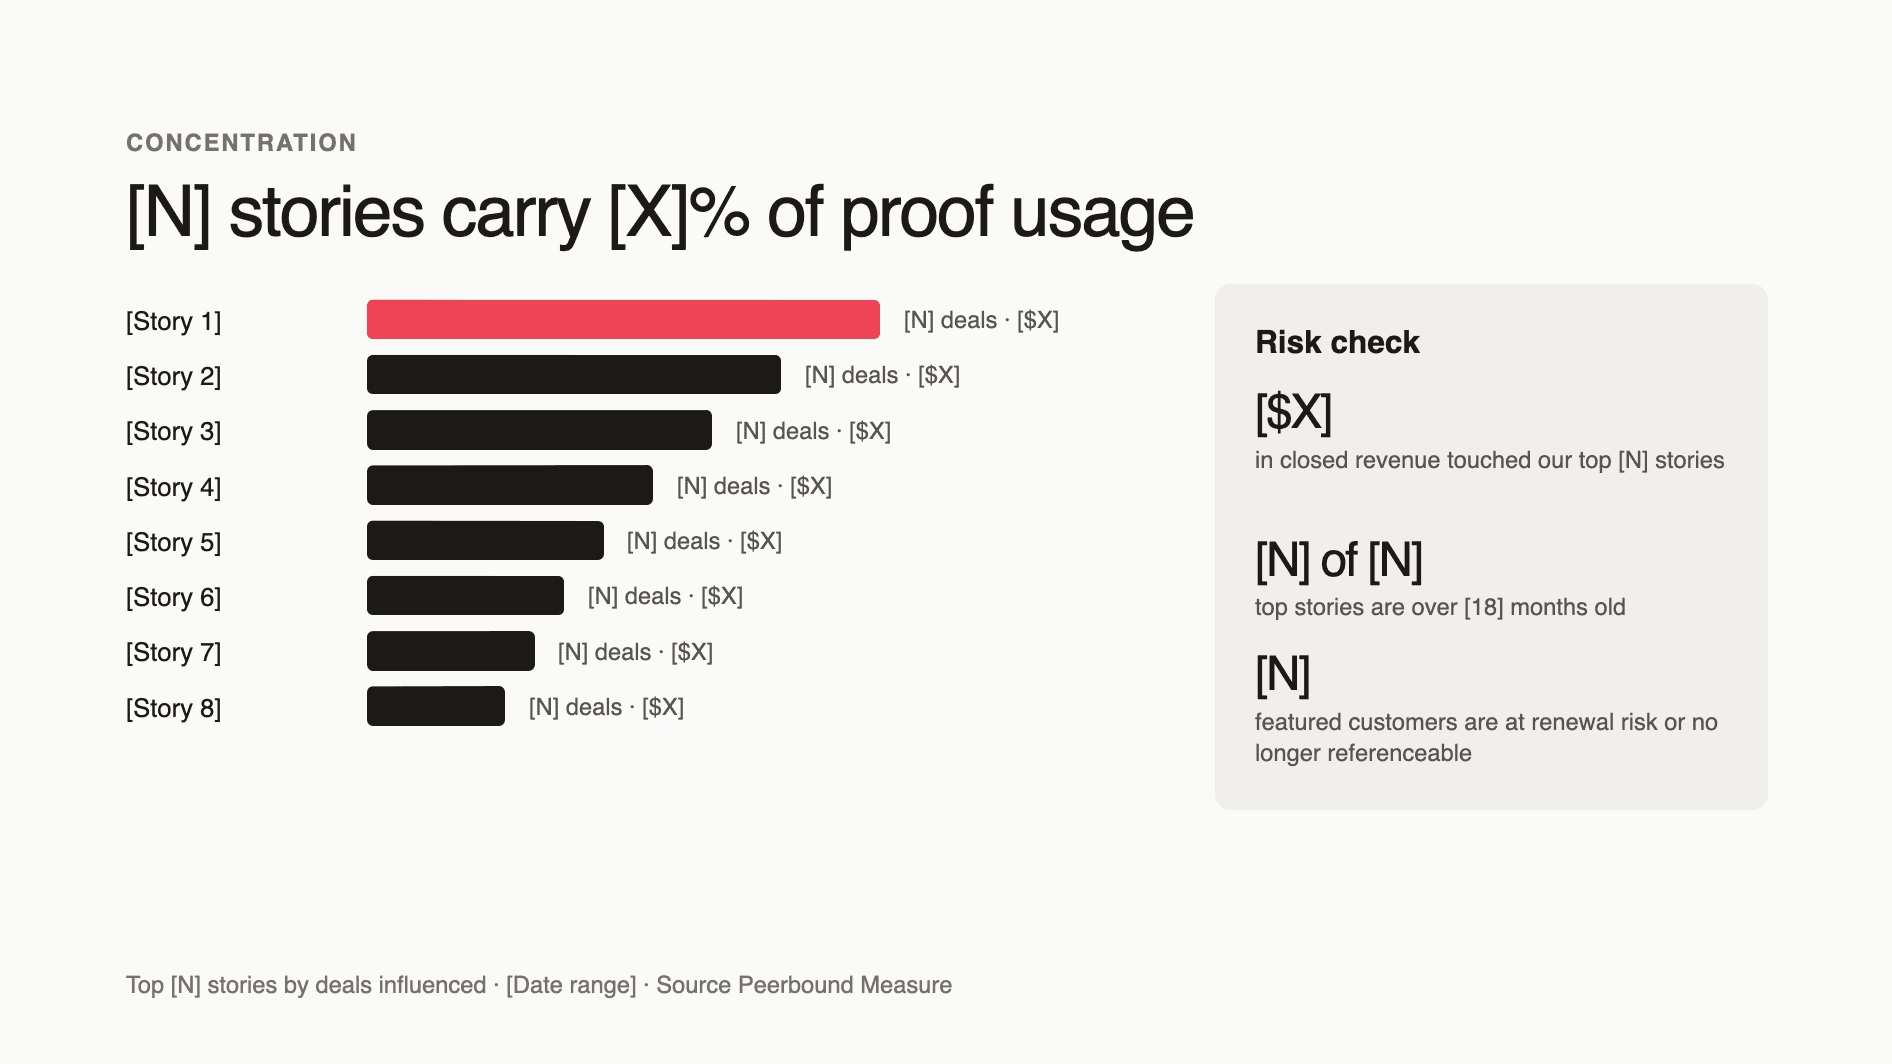
Measure's proof mentions by customer table ranks each customer by the deals their proof touched, the revenue those deals brought in, and its momentum. You can click any customer to open a feed of every mention. Each one shows the prospect, the deal stage, the rep, the specific asset cited, and what the rep said.
Together, this shows your CMO which customers and assets drive the most revenue and which to refresh next. A horizontal bar chart of your top five to 10 customers sorted by revenue, with the deal count on each bar, makes the ranking easy to read.
4. Your largest wins and the case study each referenced
Show your CMO which case study helped close which deal by exporting the proof mentions feed from Measure and giving it to an LLM along with the customer mention ranking and their revenue values. Show the result as a 6-10 row table with the account, the case study referenced, and the deal value, sorted largest first.
Account | Case study referenced | Deal value | Why it mattered |
|---|---|---|---|
Customer | Relevant case study | $X | Matched the buyer's industry, use case, or objection |
5. Rep champions
Every sales team has reps who reach for customer proof in almost every deal. Measure's rep leaderboard ranks them by proof mentions and shows each rep's most-cited customer and mix of calls and emails. In the example data, the top rep logged 34 proof mentions with nearly a 50/50 split between calls and emails.

Show your top five to 10 reps as a leaderboard. Then pair their mentions with closed-won deals in an export. Feature the reps who share customer proof often and win often, and use their deals as examples when you train the rest of the team.
Add one adoption number beside the leaderboard: the share of qualified opportunities with customer proof to show your CMO how far the habit has spread across the team.
6. Content gaps
Run a volume analysis on the Slack or Teams channels where sales asks Peerbound for customer proof. Export the requests, have an LLM group them by vertical, and rank the verticals GTM asks for most.
Sometimes no relevant customer proof exists yet, which is a content gap. Report the result as a ranked table with the vertical, request volume, current coverage, and the recommended action.
Vertical | Request volume | Current coverage | Recommended action |
|---|---|---|---|
Retail and CPG | High | No flagship story | Prioritize a retail case study |
Financial services | High | Partial coverage | Add banking proof cleared for compliance review |
Existing category | Moderate | Several relevant assets | Improve tagging, search, and rep enablement |
7. Your biggest opportunities moving forward
Close by showing where your work goes from here. Turn your findings into a handful of opportunities, and tie each one to the data point that supports it. That way, every next step traces back to something your CMO has already seen.
Some opportunities are about creating customer proof, and others are about getting it into more deals, like making it easier for reps to find or delivering it at the right moment. Here are three examples:
Get customer proof into more live deals. Train reps, improve findability, and deliver matched proof after sales calls with Peerbound's Proactive Proof. Track the share of qualified opportunities with customer proof.
Cover the most-requested verticals. Prioritize the segments where sales demand is high, and coverage is thin. Track usage and win rate in those segments.
Refresh your top-performing stories. Update the customers already tied to the most revenue so their results and use cases stay current. Track usage and influenced revenue after the refresh.
For each one, give a timeline, the support you need from your CMO, and the metric you expect to move. Finally, flag anything already underway so your CMO sees the work in motion.
How do you turn the data into a CMO presentation?
One order works well for most readouts: prove the revenue, show what's driving it, and then share where your work goes next.
Open with a one-slide summary. Put your strongest revenue number, your win rate lift, and one standout win on the first slide. This is the slide some executives will remember, so write the headline as the sentence you want your CMO to repeat.
Give every number context. Show each core metric next to last quarter and a target. If this is your first readout, use a baseline in place of last quarter and set targets you can defend.
Write headlines as takeaways. A headline that states the conclusion does more work than a label. Keep one idea per slide, and label every chart with its source, date range, and sample size.
Stronger headline | Weaker headline |
|---|---|
Customer proof appeared in $12.9M of closed-won revenue | Revenue influenced |
Customer proof deals win 1.4x as often | Win rate |
Sales asks for retail proof more than any other vertical | Content gaps |
Keep one set of definitions. Use one date range and one set of filters across the deck, and add an appendix that defines each metric. Also, check that every ratio matches its inputs before you present.
Close with a few priorities. Three is usually enough. Tie each one to the data that supports it, name an owner and a timeline, and predict the metric you expect it to move. Say plainly what you need from your CMO, whether that's a decision, budget, or help from another team. End by naming the numbers you'll report next quarter, which sets up your next readout.
What should your deck answer before you present?
Run through these questions before the meeting. If the deck answers each one, it's ready.
How much closed-won revenue did customer proof influence, and what share of total revenue is that?
How does win rate compare with and without customer proof?
Which customers and named wins carry the most revenue?
Which reps share customer proof often and win often?
Which requests are content gaps, and which are discovery gaps?
What are your 3-6 top priorities, and who owns each one?
What do you need from your CMO?
Which numbers will you report next quarter?
Frequently asked questions
What customer proof data should I show my CMO?
Start with revenue influenced by customer proof and win rate with and without it. Add your top customers and largest wins, your rep champions, and the content gaps sales has flagged. Close with three priorities tied to that data.
How do you measure the revenue impact of customer proof?
Compare closed-won revenue and win rates for deals where customer proof appeared against deals where it didn't. Start both groups at the same deal stage and use the same date range. This requires connecting proof usage, such as case studies cited on calls or sent by email, to deals in your CRM.
How do you prove the ROI of customer marketing?
Show how much closed-won revenue customer proof influenced and how win rates compare for deals with and without it. Pair those numbers with the customer stories and named wins behind them.
What is Peerbound Measure?
Peerbound Measure connects every customer proof touchpoint, including call mentions and email sends, to deals in Salesforce. It shows which proof appeared in closed deals, how win rate changes when proof is used, and which assets reps cite most.
How do you track which case studies sales uses?
Track every place reps use customer proof, including call mentions, email sends and Slack or Teams requests, and connect each one to a deal in your CRM. Peerbound Measure does this automatically and ranks which customers and assets reps cite most.
How does Peerbound Measure help CMOs see the revenue impact of customer proof?
Measure ties customer proof to closed-won revenue and win rates in Salesforce, so a CMO can see what customer marketing contributes to revenue. Every view filters by your own Salesforce fields and exports for deeper analysis.
Does customer proof actually impact close rates?
Yes. At Gainsight, new-business deals where reps used customer proof saw a 2.5x higher win rate, rising to 5.7x on one product line, tracked in Peerbound Measure. At Canva, deals with customer proof won 24% of the time versus 18% without it, about 1.3x as often.
Discover the key customer proof metrics, revenue data, and strategies to include in your next CMO presentation using Peerbound Measure.