

What if you could see exactly what customer proof your sales team searches for when they are trying to close deals?
At Peerbound, our team analyzed 6,000+ real queries from sales representatives across multiple B2B SaaS companies using the Peerbound Slack app. This is the first research of its kind examining actual sales behavior, not surveys or assumptions.
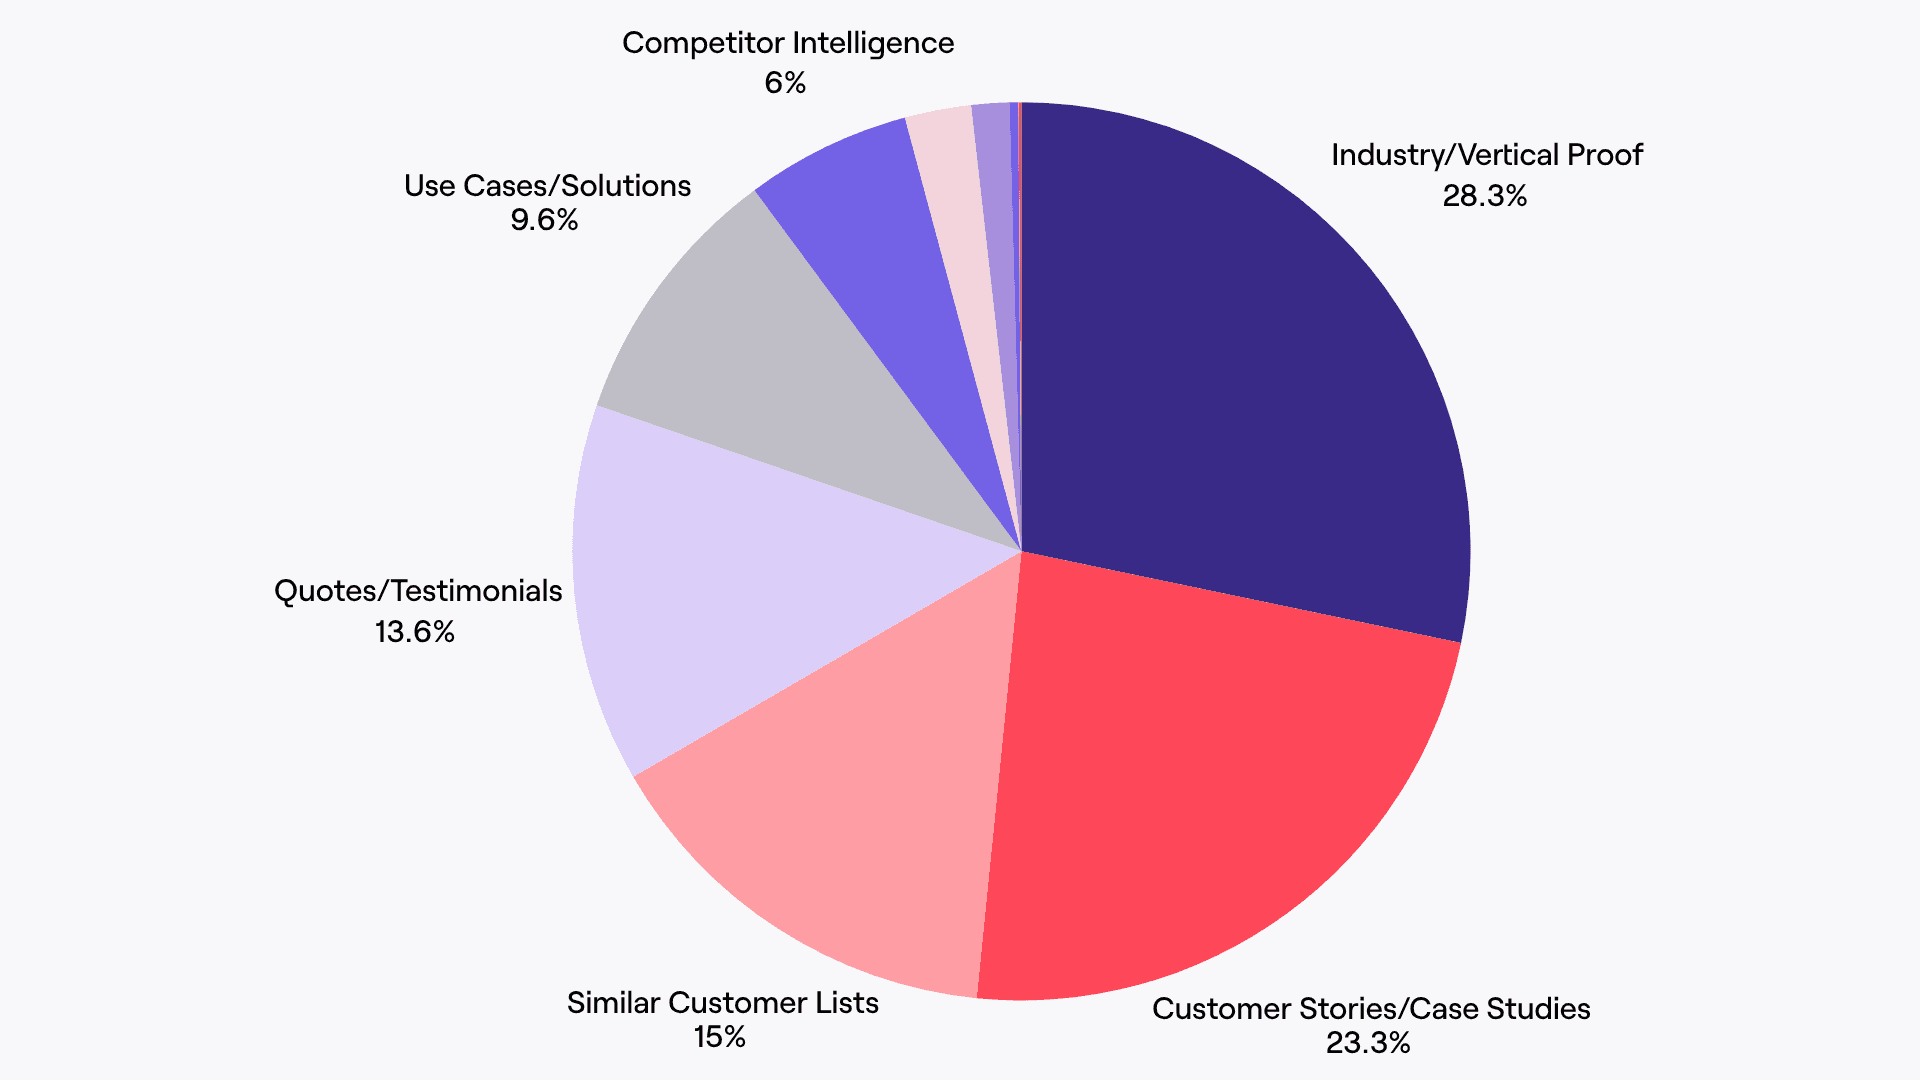
The results: 66.6% of all sales queries fall into just three categories: industry-specific proof (28.3%), case studies (23.3%), and similar customer examples (15%). While marketing creates customer proof on an ongoing basis, 65% of B2B sales content goes unused and 50% of all prospect engagement is just generated with 10% of sales enablement content. The problem often isn't volume, but gaps in proof and discoverability.
This research report provides:
Complete breakdown of 6,000+ sales queries by category and intent
Comparison to industry benchmarks showing the gap between creation and usage
Tactical frameworks for reorganizing customer proof based on search patterns
Why this matters: Underused or unused marketing content costs enterprises approximately $2.3 million annually in missed opportunities and companies with a sales enablement strategy achieve a 49% more win rate on forecasted deals.
The Research: 6,000+ Queries Analyzed
Methodology
We analyzed every query submitted to the Peerbound Slack app by sales representatives in 2025. This includes companies across:
Company size: 25 to 5,000+ employees
Industries: B2B SaaS, technology, professional services
Sales team size: 5 to 500+ reps
What makes this data unique: These aren't hypothetical needs or survey responses. These are real searches made by reps actively working deals, often searching during sales conversations or immediately after prospect meetings.
The Complete Query Breakdown
Category | Queries | % of Total | What Reps Are Searching For |
Industry/Vertical Proof | 1,847 | 28.3% | "Do we have healthcare customers that…?" |
Case Studies & Success Stories | 1,523 | 23.3% | "Case study showing ROI improvement?" |
Similar Customer Examples | 982 | 15.0% | "Customers similar to [Company]?" |
Customer Quotes/Testimonials | 891 | 13.6% | "What do customers say about [feature]?" |
Specific Use Cases | 627 | 9.6% | "How are customers using [feature]?" |
Competitor Intelligence | 389 | 6.0% | "Customers who switched from [Competitor]?" |
Geographic Customer Lists | 156 | 2.4% | "Customers in Germany?" |
Value/ROI Statements | 89 | 1.4% | "Customer cost savings data?" |
Tech Integrations | 21 | 0.3% | "Customers using [Tool A] + [Tool B]?" |
Logo Rights/Permissions | 7 | 0.1% | "Can we reference [Company]?" |
The "Big Three": 66.6% of All Searches
Combined, three categories dominate sales behavior:
1. Industry-Specific Proof (28.3%) Nearly 1 in 3 searches involves a rep trying to prove "We work with companies like yours."
Example queries:
"Do we have any customers in manufacturing that …?"
"Prospecting into a cybersecurity business with fewer than 200 employees"
"What retail companies do we work with?"
2. Case Studies & Success Stories (23.3%) Almost 1 in 4 searches focuses on detailed, structured proof that can be shared with prospects.
Example queries:
"Case studies showing forecasting accuracy improvement?"
"Do we have published case studies for healthcare?"
"Case studies for big brands we've helped?"
3. Similar Customer Examples (15.0%) 15% of searches involve reps trying to provide social proof through peer validation.
Example queries:
"I'm prospecting [Company]. Do we have similar customers?"
"Give me a list of customers like [Company]"
"Who are customers similar to [Company]?"
What This Reveals: The Customer Proof Gap
The Creation vs. Usage Disconnect
When we compare how companies organize and prioritize customer proof versus what sales teams actually search for, we often see a mismatch:
The Mismatch:
Some customer and product marketing teams organize proof by:
Content type: "Case Studies" folder, "Testimonials" folder, "Videos" folder
Creation date: Newest first, regardless of relevance
Marketing campaign: "Q4 Campaign Assets," "Product Launch Materials"
Sales teams search by:
Industry and company size: "Mid-market healthcare customers"
Specific outcome: "Customers who reduced costs"
Competitor context: "Customers who switched from [Competitor X]"
Geographic region: "Enterprise customers in EMEA"
The Result: A rep searching for "fintech case study" has to open three different folders, scan dozens of files, and still might miss the perfect asset because it's named "Customer_Story_Final_v3.pdf".
Why Customer Proof Goes Unused
Industry research shows that 65% of B2B sales content goes unused. Our query data reveals why this happens specifically with customer proof:
Problem #1: Creation Effort Doesn't Match Demand
High demand + High effort = Undercreated
Industry-specific case studies: 28.3% of searches, but take approximately 40 hours to produce (and even longer to approve) with traditional methods
Competitor win stories: 6% of searches, but require sensitive customer conversations
High demand + Low effort = Should be overcreated but often aren't
Customer quotes: 13.6% of searches, can be extracted from existing calls in minutes (especially using AI)
Similar customer lists: 15% of searches, just require organized CRM data (bonus if you also have logo permissions denoted)
Problem #2: Sales Teams Can’t Find It
There are several reasons customer proof isn’t discoverable:
It’s tagged with the customer name instead of the customer vertical
CRM data is not up to date
The enablement solution isn’t easy to navigate
Problem #3: It’s Not Accessible in Time-Sensitive Scenarios
Current state: 2 hours to find relevant customer proof
What sales needs: Less than 2 minutes (ideally less than 30 seconds)
When proof is needed: During calls or immediately after prospect meetings
The Bottom Line: It's not that companies lack customer proof. The problem is organization, tagging, and accessibility.
Solution: There are many ways to get started right away in organizing your proof but consider using AI to become more efficient. Peerbound customers report significantly reduced time in searching for and creating customer proof and case studies, thanks to AI!
1. Motive achieved a 50% reduction in content creation time, with drafts produced in 30 seconds compared to the previous 8-hour process, showcasing time efficiency. The Peerbound Slack app enhanced sales efficiency by instantly delivering customer insights without sifting through transcripts, boosting team productivity.
2. Amperity reduced time for customer story creation by 80%, cutting down isolation in sales knowledge. Stories are now 4 times faster to create and approve. Peerbound also replaced slow, ad-hoc searches with a centralized hub, allowing sales reps to find customer proof instantly, streamlining meeting preparations.
3. Tipalti reduced the production timeline for case studies from months to weeks, enhancing speed and output.
4. Clari noted a 40-hour monthly time savings by streamlining customer proof discovery, making sales more efficient. Peerbound's AI agents fetch the perfect proof for sales reps, enabling a self-serve model where customer proof finds the reps, saving significant time.
Deep Dive: The Top 4 Query Categories
Category 1: Industry-Specific Proof (28.3% of Searches)
Why This Dominates Search Behavior:
When prospects evaluate B2B software, industry relevance is their first filter. Our query data shows reps aren't just searching for industries, they are also double-filtering:
"Cybersecurity business with less than 200 employees" = industry + size
"Mid-market healthcare customers" = industry + segment
"Enterprise fintech in EMEA" = industry + size + geography
Actionable Framework: Industry Coverage Heat Map
Create a visual audit showing proof coverage by industry.
Coverage Score Formula:
Green (Strong): 3+ case studies OR 8+ testimonials
Yellow (Weak): 1-2 case studies OR 4-7 testimonials
Red (Critical): 0 case studies AND <4 testimonials
Implementation Priority:
Calculate what % of your revenue comes from each industry
Cross-reference with search frequency
Prioritize filling gaps in high-revenue and high-search industries
Success Metric: 80% of your top-revenue industries should have "strong" coverage.
Category 2: Case Studies & Success Stories (23.3% of Searches)
What the Query Patterns Reveal:
Analyzing the way reps search for case studies shows critical gaps:
"Do we have any published case studies?" → Indicates reps need shareable links and snackable assets, not internal PDFs
"Case studies showing forecasting accuracy?" → Shows reps search by outcome, not by customer name
"Case studies for big brands?" → Reveals logo recognition increases shareability
Industry context: According to Demand Gen Report’s 2024 Content Preferences Study, 77% of B2B buyers said they used case studies to research purchasing decisions.
Actionable Framework: The Modular Case Study System
Instead of creating monolithic PDFs, structure every case study as extractable assets:
Asset 1: The Hook (Problem and Industry)
1-sentence customer quote about pain point
Use in: Email subject lines, Slack messages, SDR outreach
Asset 2: The Solution (How They Use Your Product)
Specific features/workflows implemented
Use in: Feature-specific conversations, sales decks
Asset 3: The Proof (Metrics and Outcomes)
Quantified results with attribution
Use in: Sales decks, ROI conversations, CFO approval
Asset 4: The Voice (Customer Quotes)
Pull-quotes that stand alone
Use in: Sales decks, social media, ads, SDR outreach
Production Target: 1 complete modular case study per month
Minimum viable: 8 per year
Best-in-class: 15+ per year
Tagging Strategy Based on Query Patterns:
Tag every case study with:
Primary outcome (cost savings, time savings, revenue growth)
Brand tier (Enterprise versus SMB)
Competitive context (switched from [Competitor] or new category)
Specific product/feature highlighted
Success Metric: A rep can find a relevant case study in less than 2 minutes, 90% of the time.
Category 3: Similar Customer Lists (15.0% of Searches)
Underlying Psychology:
This category represents one of the most powerful forms of social proof. Prospects ask: "Do you have customers I would trust and respect?"
Insight From Query Timing: These searches typically happen during or right after sales calls where the prospect mentioned a peer company. The rep needs an answer in seconds, not hours.
Benchmark Context: According to Gartner Digital Markets research, 90% of buyers rely on social proof when comparing products, and 71% stick with their first choice after creating their shortlist.
Actionable Framework: Multi-Dimensional Similarity Matrix
"Similar" is subjective. Build a scoring system across multiple dimensions:
Similarity Scoring Weights:
Industry alignment: 40%
Company size/scale: 25%
Tech stack overlap: 15%
Use case match: 15%
Growth stage: 5%
Example: Prospect: "Stripe" (payment processing, high-growth fintech, developer-focused)
Your similar customers ranked:
Plaid (Score: 92) Same industry, similar scale, dev tools
Braintree (Score: 88) Payments, mid-market, technical buyers
Adyen (Score: 85) Payments, enterprise, global scale
Implementation Options:
Manual (Week 1):
Create "Pre-Built Lists" for your 10 most common prospect profiles
Update monthly
AI-Powered (Month 1-3):
Integrate with CRM to auto-detect prospect attributes
Generate similar customer lists on-demand
Include context: "These 5 customers faced similar challenges"
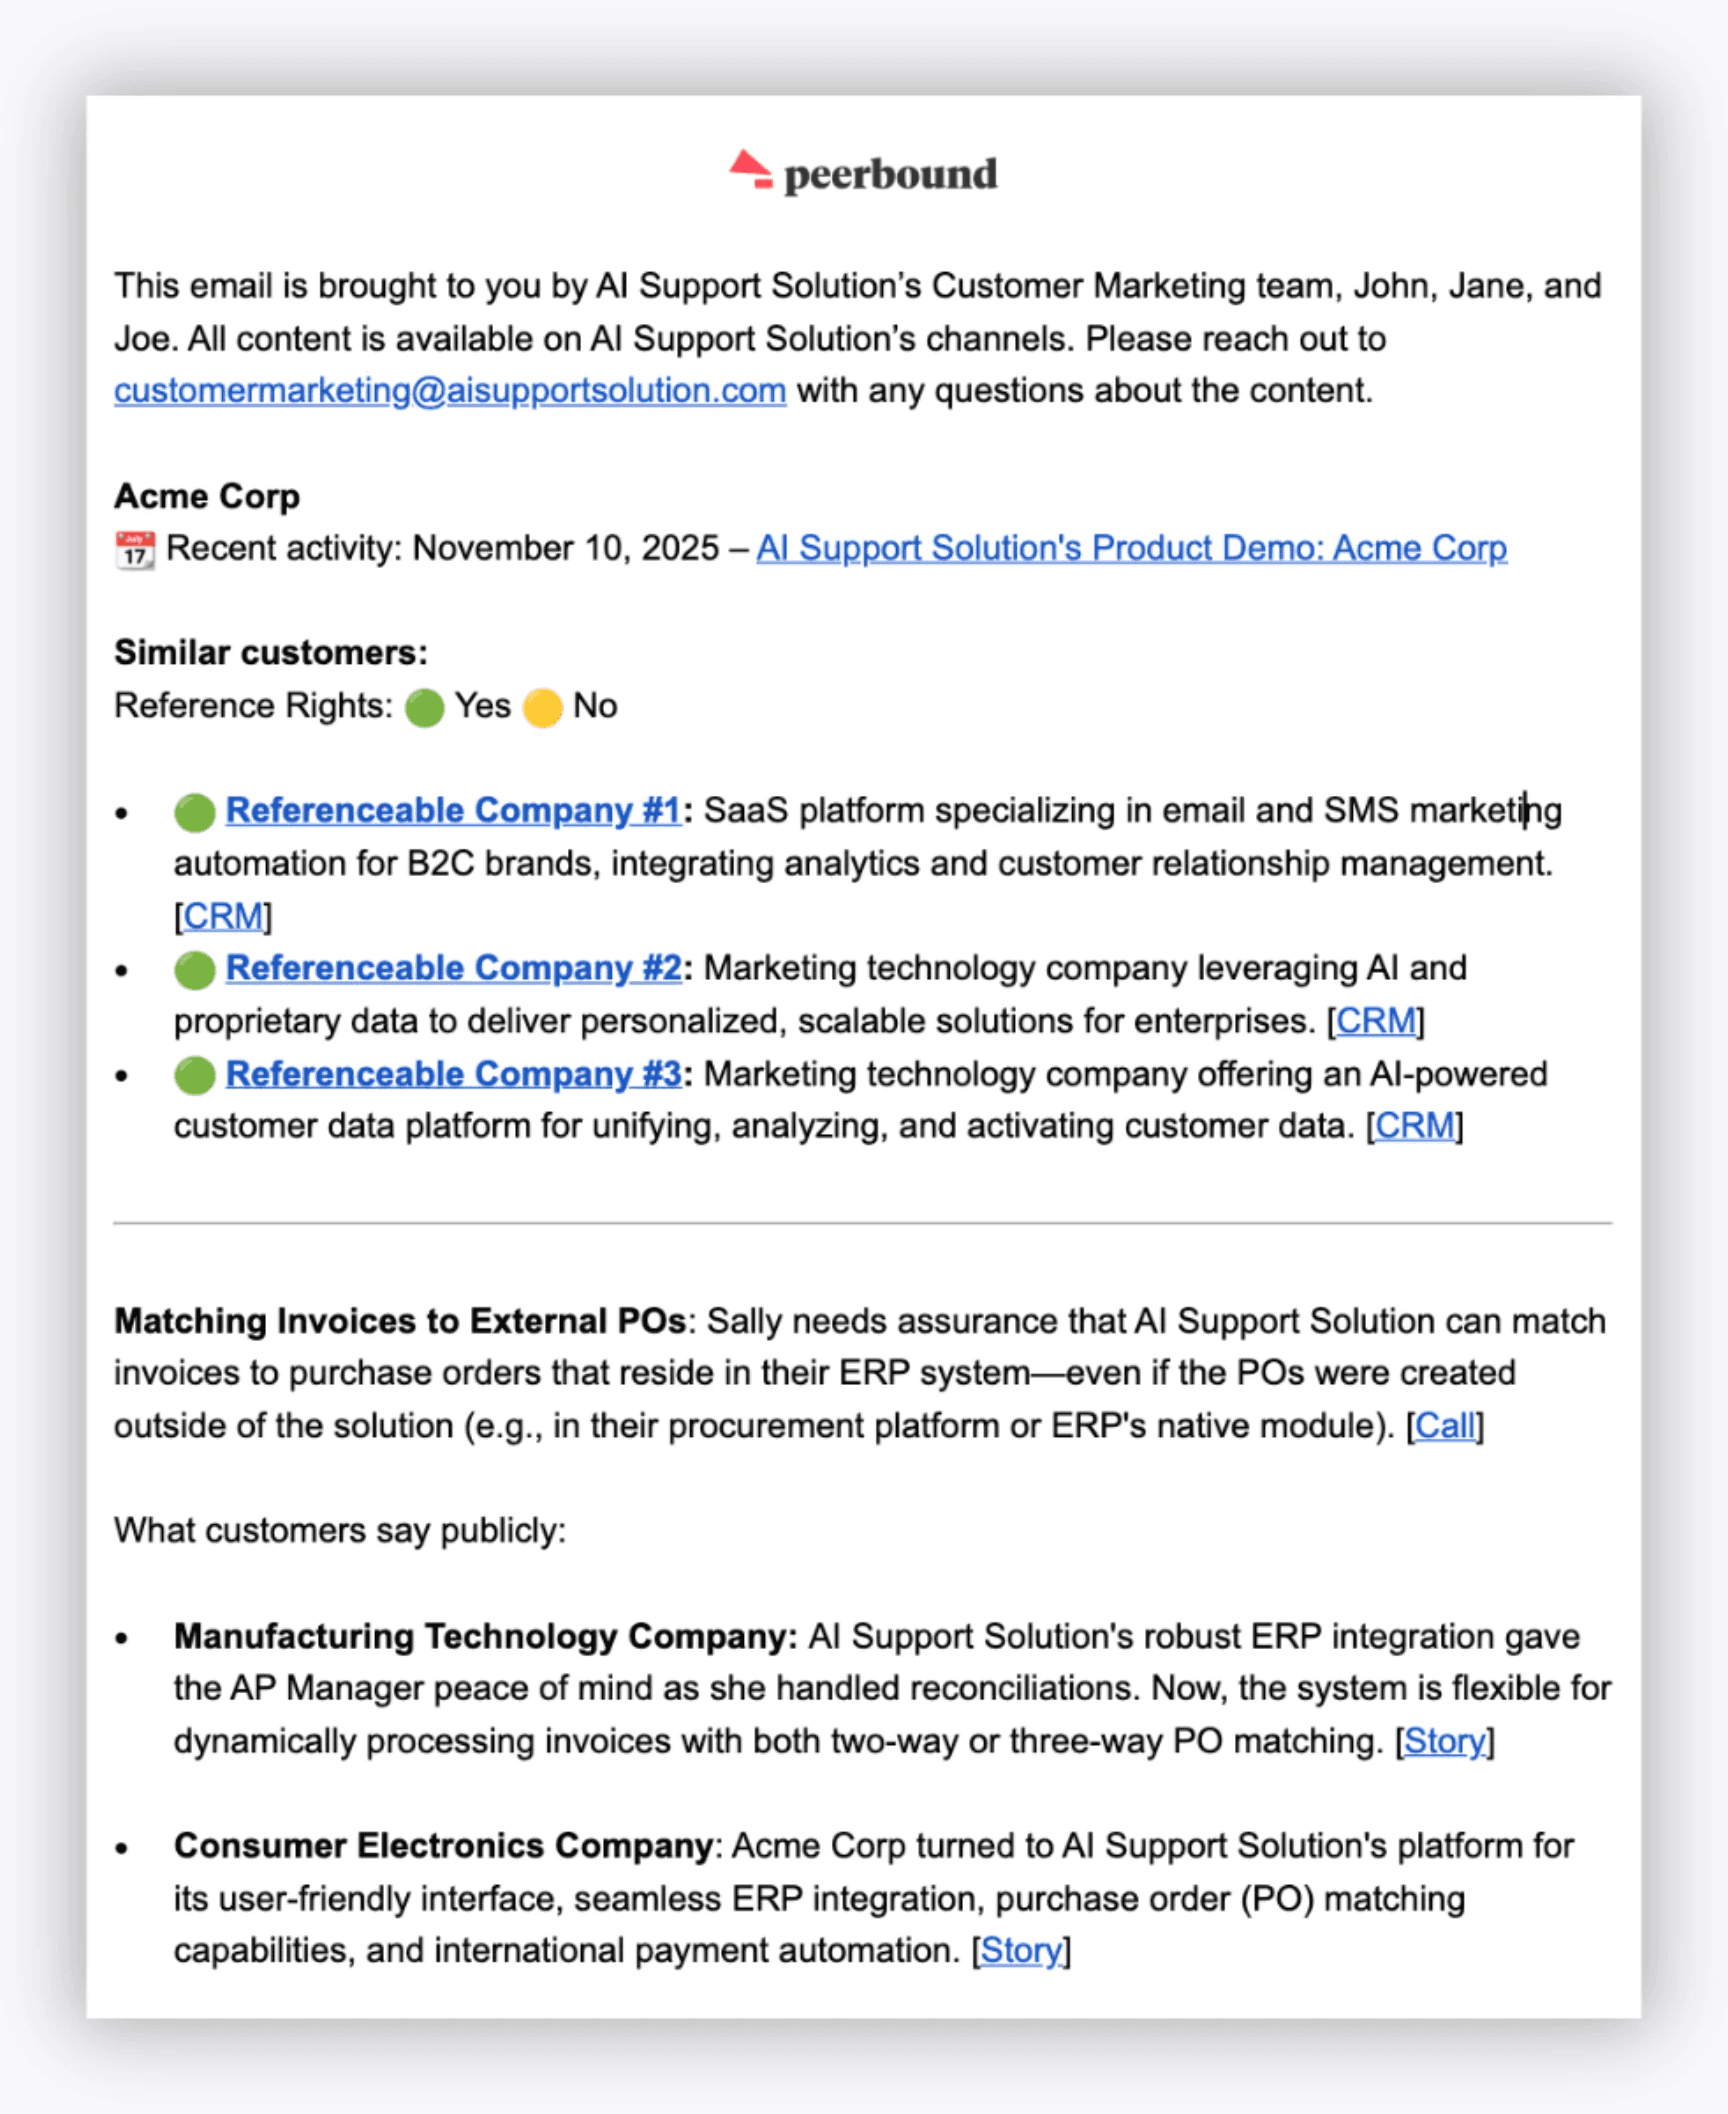
Share it proactively with a post-call email directly to the reps via tools like Peerbound.
Success Metric: Time to generate similar customer list drops from 1-2 hours hours to less than 2 minutes.
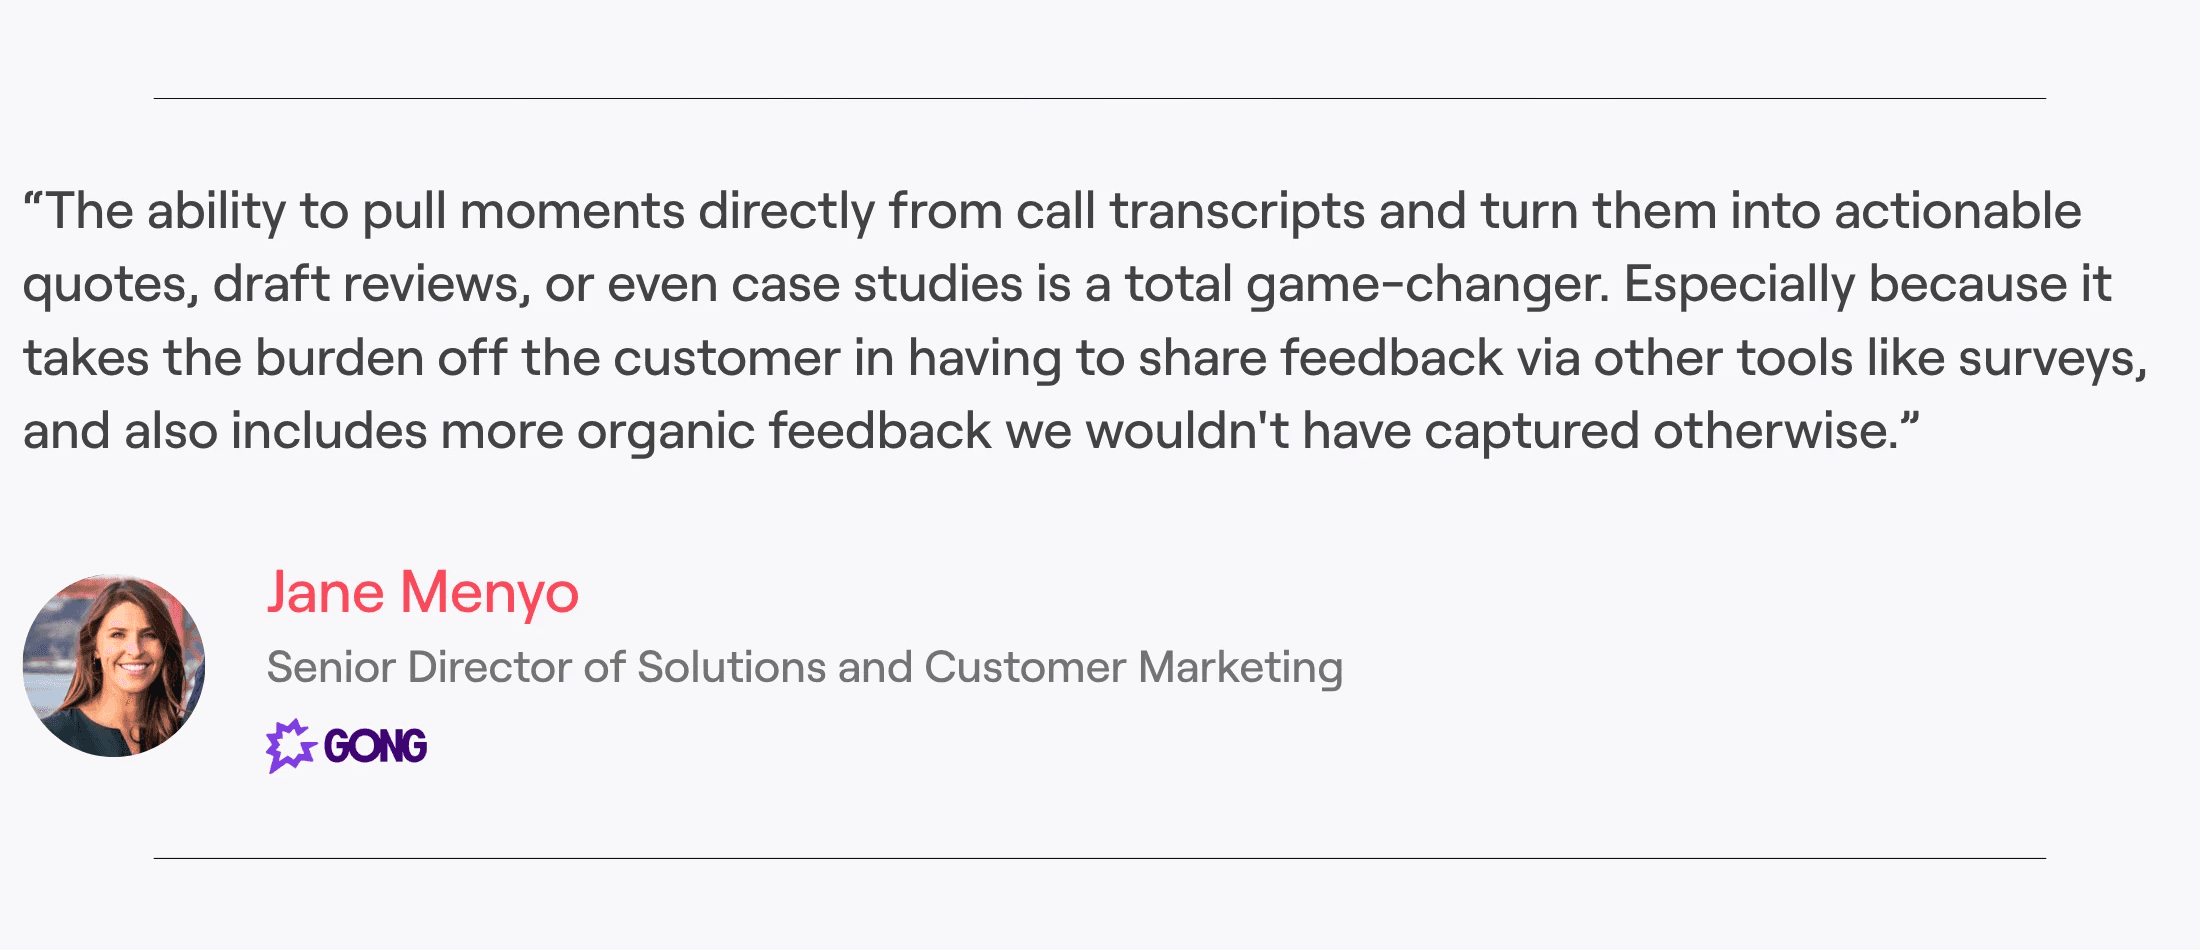
Category 4: Customer Quotes & Testimonials (13.6% of Searches)
What Makes This Category Valuable:
Customer quotes have the best effort-to-impact ratio:
Low creation effort (extract from existing calls)
High usage frequency (13.6% of searches)
Versatile (email, decks, social, ads)
Query Pattern Insights:
"What do customers say about [Competitor]?" → Indicates competitive quotes are high-value
"Customer quotes about onboarding?" → Shows reps search by topic/feature
"Pull quotes from customers about [Brand]?" → Indicates brand-name searches include competitive context
Actionable Framework: Automated Quote Library
Week 1: Manual Collection
Search your call recording software for keywords: "results," "value," "solved," "impressed"
Extract 20-30 quotable moments
Tag by: feature, outcome, industry, competitor mentioned
Month 1-2: AI-Powered Extraction
Set up Peerbound or similar to auto-flag positive sentiment as it happens
Weekly digest: "Top 10 Customer Quotes This Week"
#customer-love Slack channel and personalized channels for various internal audiences based on keywords
One-click client approval workflow of upvoted quotes
Quote Collection Triggers:
Post-onboarding (30-60 days)
After successful QBR
Following promoter NPS score (9-10)
When customer mentions outcome/metric
Organization by Search Intent:
By feature: "Quotes About [Feature]"
By competitor: "Why Customers Switched From [Competitor]"
By outcome: "ROI & Cost Savings Quotes"
By objection: "Overcoming [Common Objection]"
Success Metric: 50+ tagged, approved customer quotes in searchable library within 90 days. Live searchable output (like Slack) where sales can search for quotes on-demand.
The Search-to-Find Score: Interactive Worksheet
Calculating where to make adjustments can be tricky, but here is a quick way to think about the strength of your customer proof:
Strong: You have enough proof AND it’s discoverable
Weak: You have some proof BUT it's hard to find or outdated
Critical: You have little to no proof for this category
Calculate Your Search-to-Find Score
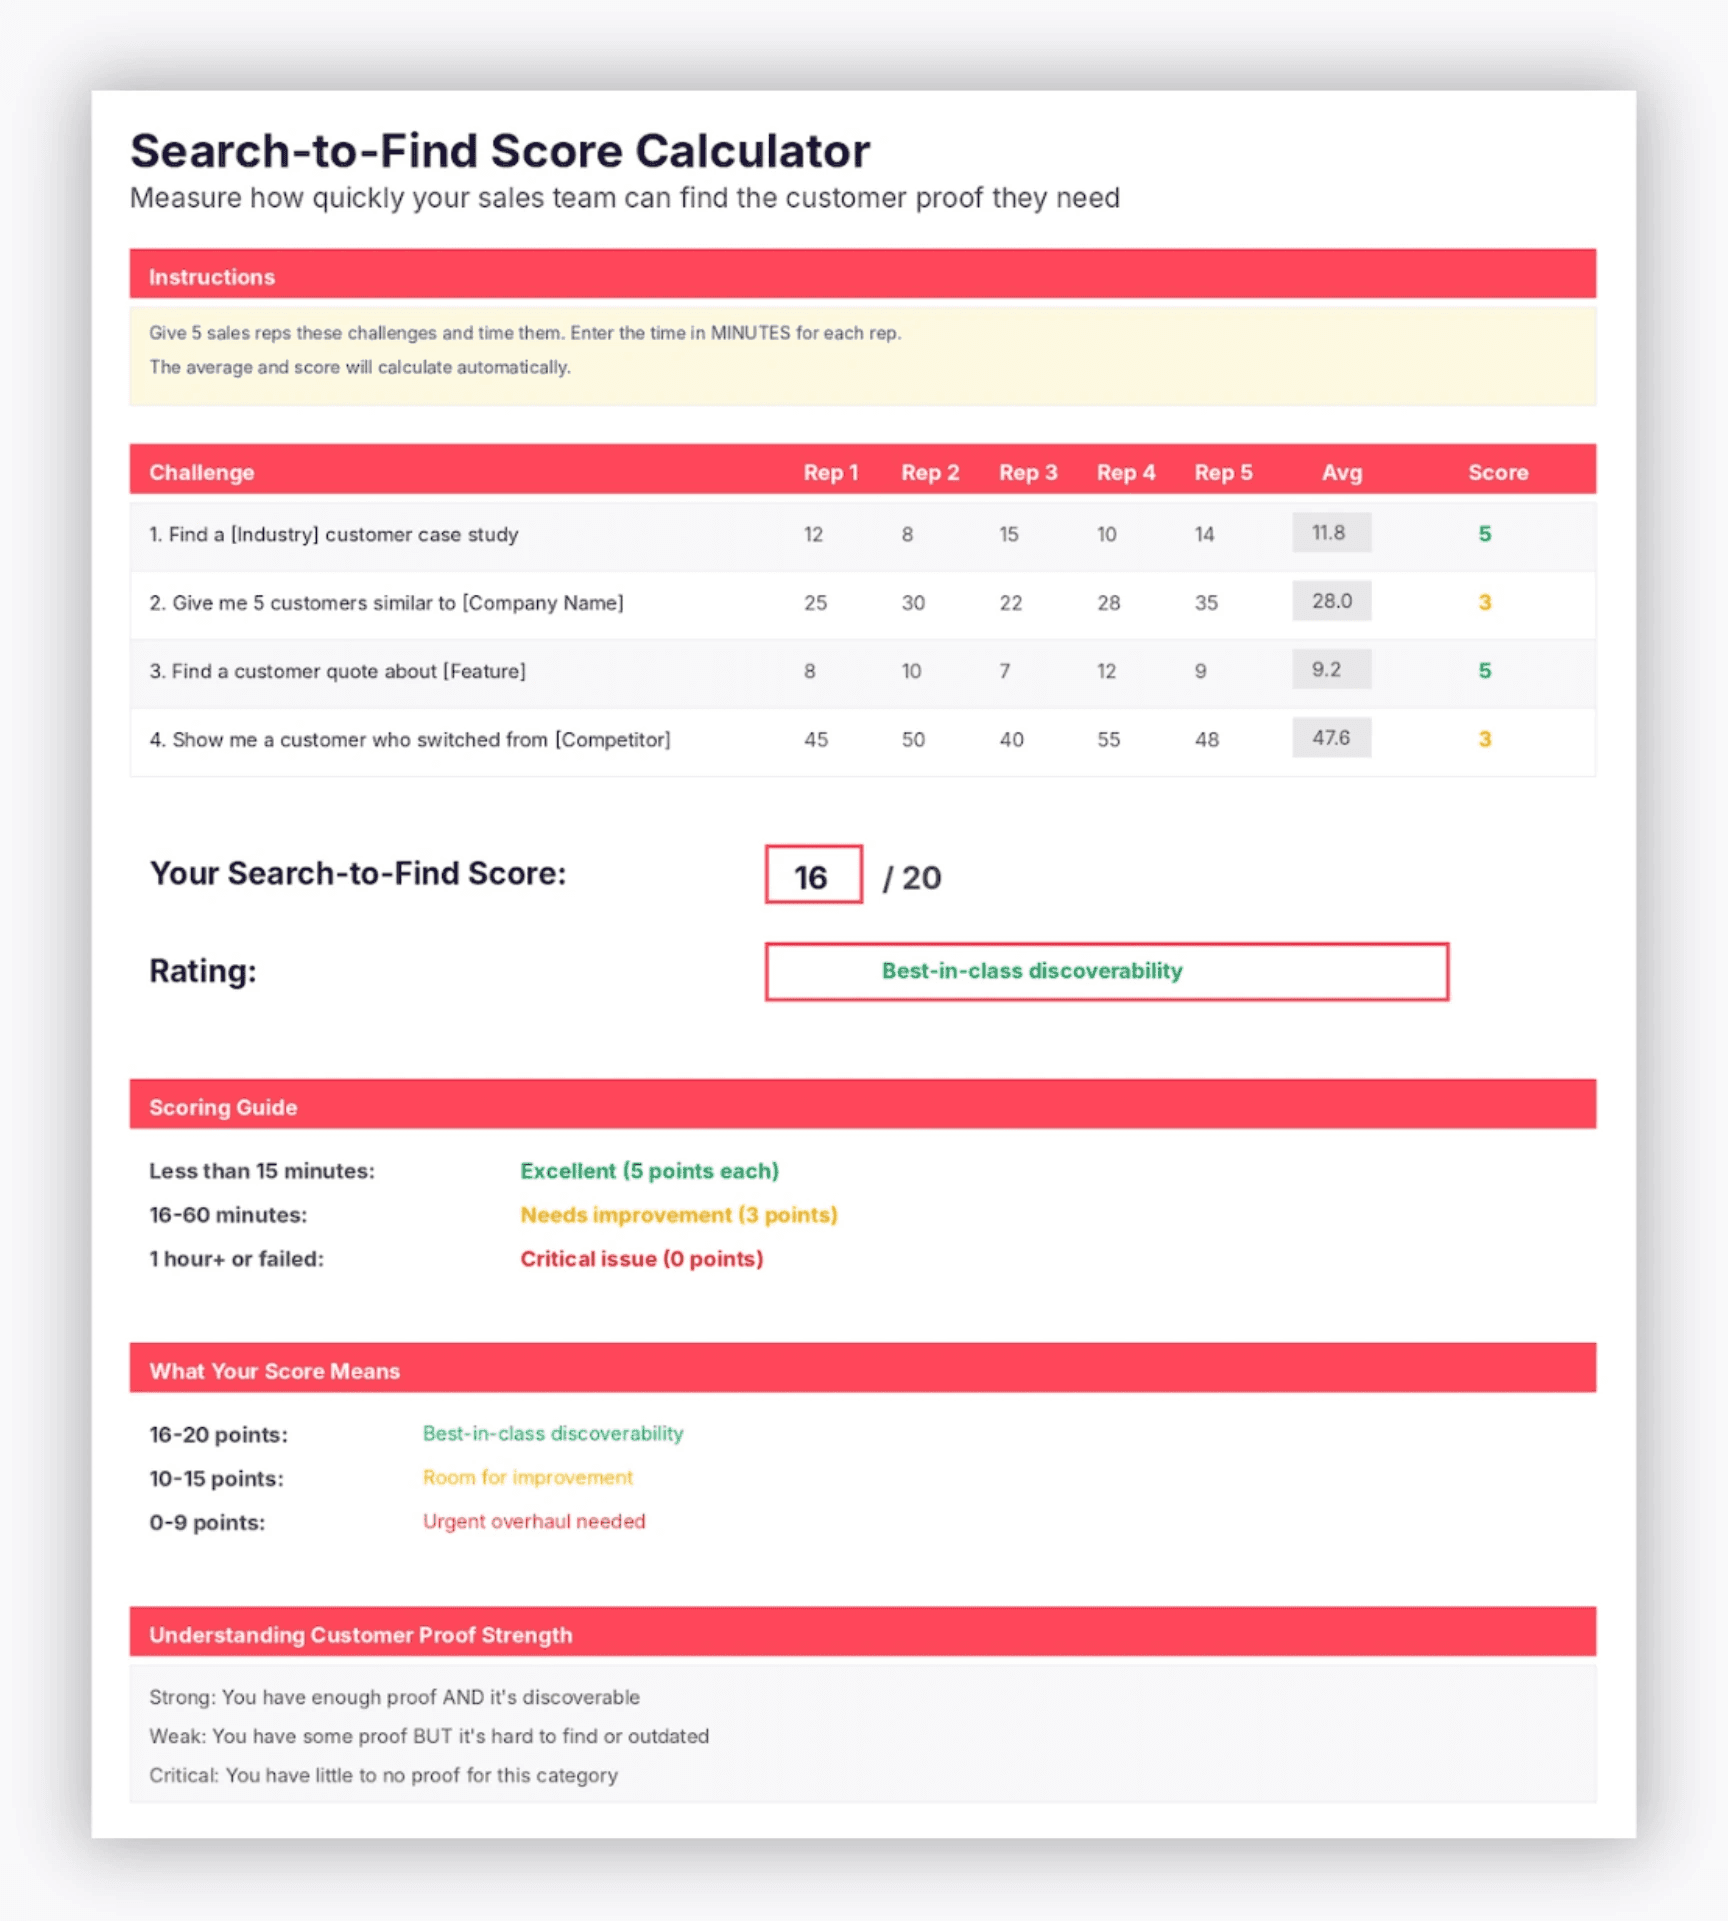
The Test: Give 5 sales reps these challenges and time them:
"Find a [Industry] customer case study" → Average time: ___
"Give me 5 customers similar to [Company Name]" → Average time: ___
"Find a customer quote about [Feature]" → Average time: ___
"Show me a customer who switched from [Competitor]" → Average time: ___
Scoring:
Less than 15 minutes: ✅ Excellent (5 points each)
16 minutes - 1hour: ⚠️ Needs improvement (3 points)
1hour + or failed: ❌ Critical issue (0 points)
Your Search-to-Find Score: _____ / 20
16-20: Best-in-class discoverability
10-15: Room for improvement
0-9: Urgent overhaul needed
Prioritize Your Next 90 Days
Based on your audit:
My Top 3 Content Gaps:
1.
2.
My Top 3 Discoverability Issues:
1.
2.
My 90-Day Action Plan:
Month 1: Fix the Findability Crisis
⃞ Tag all existing customer proof by industry, outcome, competitor
⃞ Set up Slack search OR create searchable spreadsheet
⃞ Remove proof from any churned customers
Month 2: Fill Critical Gaps
⃞ Create ___ new case studies for gap industries
⃞ Extract ___ customer quotes from recent calls
⃞ Build ___ "similar customer" lists for common prospect profiles
Month 3: Activate & Measure
⃞ Train sales team on new search system
⃞ Set up proactive proof delivery (post-call automation)
⃞ Measure: Search-to-find time, win rate with proof, usage metrics
Measuring ROI: Proving Customer Marketing Drives Revenue
The Metrics That Matter
Leading Indicators (Track Monthly):
Time to find relevant proof (Target: less than 2 minutes)
% of opportunities with proof attached (Target: 50%+)
Sales rep adoption rate (Target: 80%+ using system monthly)
New proof pieces created per month (Target: 5-10)
Lagging Indicators (Track Quarterly):
Win rate with proof versus. without: Companies with a sales enablement strategy achieve a 49% more win rate on forecasted deals
Sales cycle length with proof versus without: Target 15-20% reduction
Deal size correlation: Track average deal size when proof is used
Customer retention for advocacy participants: Advocates churn less
The ROI Calculation
Formula:
Annual Value = (Incremental Wins × Avg Deal Size) - Program Cost
Example Scenario:
Total deals per year: 100
Current win rate: 42%
Win rate with organized proof: 49%
Improvement: 7 additional wins per year
Average deal size: $75K
Annual program cost: $200K (1 FTE + tools + production)
ROI Calculation:
Incremental revenue: 7 wins × $75K = $525K
Program cost: $200K
Net value: $325K
ROI: 162% return
Break-Even Analysis: At what point does investment pay off?
Need to close 2.67 additional deals to break even ($200K / $75K)
A 2.67% improvement in win rate breaks even
You have 2.4 times cushion above break-even
Frequently Asked Questions
How often should you refresh customer proof?
Customer proof should ideally be refreshed on an ongoing basis through the use of tools that monitor intelligence proactively. For meatier pieces, you can refresh on a less frequent basis.
Refresh Schedule:
High-frequency assets (top industries, common use cases): Every 6 months
Medium-frequency assets: Every 12 months
Low-frequency assets: Every 18 months or when customer achieves new results
Immediate actions: Archive any proof from churned customers the same day you learn about churn.
What's the fastest way to fill gaps revealed by this analysis?
First step manual wins:
Mine existing conversations for quotes (5-15 hours)
Search call recording transcripts for positive sentiment
Extract 20-30 quotable moments and edit them
Get client approval via email
Create "similar customer" lists (10-20 hours)
Export CRM data
Group by industry + size
Create 5-10 pre-built lists and logo folders or slides
Audit and tag existing case studies (10-20 hours)
Add industry, outcome, competitor tags
Make them searchable
AI automation for longer-term gains:
Implement AI software like Peerbound (1 week-1 month)
Integrate call recording software, G2, case studies, and more
Set-up Slack channels with keywords for different audiences
Turn on Proactive Proof emails that send proof automatically to reps post every call
Get one-click client approval for quotes
Create AI-generated case studies and G2 reviews and send to clients for approval
Investment: The manual approach can help fix immediate gaps, but you will need to be proactive about updating your content library. With AI, customer proof mining and editing could be automated to be immediate.
How do you get sales to actually use the proof system you built?
Based on adoption patterns from high-usage companies:
Make it effortless:
Meet them where they work (i.e., Slack, not a separate portal)
Search should take less than 2 minutes
Results should be copy-paste ready
Make it proactive:
Auto-send relevant proof after every call
Include lookalike customers in opportunity alerts
Suggest proof before they search
Make it visible:
Track usage and celebrate wins
Show win rate data: "Deals with proof close at 49% vs. 42% without"
Feature top users in team meetings
Engage sales leaders to promote adoption
Leadership feedback: According to sales leaders, the three biggest barriers to sales and marketing alignment are poor communication between teams (38%), misalignment on goals or strategies (30%), and lack of sales input on marketing content (27%).
Takeaways: How to Use This Research
The Core Insights
66.6% of sales searches fall into 3 categories: industry proof, case studies, similar customers. Organize your library around these, not around content types.
Search timing matters.Queries (similar customers) happen during/right after calls, requiring quick response times.
The customer proof gap is real. 65% of B2B sales content goes unused. The issue is organization and accessibility, not volume.
Discoverability = impact. The best proof in the world is worthless if it takes hours to find.
ROI is measurable.Companies with a sales enablement strategy achieve a 49% more win rate on forecasted deals = direct revenue impact.
Your Next Steps
This week:
Complete the Industry Coverage Heatmap
Calculate your Search-to-Find Score
Identify your top 3 gaps
This month:
Tag all existing proof by industry, outcome, competitor
Set up searchable system
Extract 20+ customer quotes from recent calls
This quarter:
Fill critical gaps in high-frequency categories
Implement proactive proof delivery
Measure win rate impact
Want Help Implementing This Research?
This analysis is based on data from the Peerbound platform, which automatically:
Surfaces customer quotes from calls
Organizes proof by search patterns (industry, outcome, competitor)
Delivers proactive proof to sales reps via Slack and email
Creates marketing-ready case studies and reviews
About This Research
This analysis examined 6,532 queries submitted to the Peerbound Slackbot from Q1-Q4 2025 by sales representatives across multiple B2B SaaS companies. This research was conducted to help customer marketers and sales enablement leaders build more effective customer proof programs based on actual sales behavior rather than assumptions.
For questions about methodology or to share your own findings: marketing@peerbound.com.
What customer proof closes deals? Analysis of 6,000+ sales queries shows 66.6% search for just 3 types: industry proof, case studies, and similar customers.


